nanoStream Cloud Analytics
nanoStream Cloud Analytics offers a great way to monitor and analyze the performance and quality of service of your live streams.
nanoStream Cloud and the unique nanoStream H5Live Player have been designed as an easy to use ultra-low-latency and light-weight live streaming platform. nanoStream Analytics follows the same philosophy. Easy to use, lightweight and focused on delivering our partners the information that makes their business more successful.
nanoStream Analytics provides three levels of information.
- General information about usage, traffic volume, countries, customers, IP’s and world map overview on ingest/playout
- Business intelligence, conclusions about several aggregated metrics. Example: Tagging: you can “tag” your live streams by topics or events and then query them from the Analytics dashboard. Or you want insight on how certain countries perform compared to each other. by using the country filter.
- Customers enabled for H5Live metrics will get additional insight and details about the player clients: we show H5Live player information like OS/browser, max concurrent viewers, play buffer ratio, startup time, player error codes and other events like buffer play ratio and latency, both shown as graphs and on a world map
All of this data is meant to help you improve your Quality of Service and your viewers Quality of Experience. Overall, by using nanoStream Analytics, your technical team will have full insights on how your service behaves.
In addition to improving your technical capabilities, nanoStream Analytics enables also a big advantage to your business intelligence, providing valuable data to your Management and to your Marketing and Sales teams to understand where they should strengthen your service and decide on the next steps to be taken.
Server and Service Metrics
The server and service metrics give you an overview of the total streaming volume of your live streams, where your clients are located, which streams are used most and a lot of other information.
Client Metrics
Client metrics let you analyze the experience of your users from the users point of view. If enabled in the Browser application, the client metrics are sent to our backend.
You need to have a platinum support agreement in place to make use of client metrics.
Currently the following two applications support sending metrics.
H5Live
To have metric data available for the H5Live Dashboard, you need to be enabled for H5Live player metrics.
Webcaster
Similar to the H5Live player metrics the Webcaster also supports sending metrics. If enabled you can see additional metric data on the Webcaster Dashboard.
Please reach out to sales@nanocosmos.de if you like to use it.
Analytics Dashboard
Analytics and metrics is available in several levels, dependent on your business agreement, support level and subscription plan. Please get in touch for any questions.
The default level allows you to access most of the metrics available on the different dashboards.
To see advanced metric widgets, e.g. for H5Live player metrics like "Buffering Play Ratio" or "Average and median of played time in seconds", you need the level "premium" for your organization. Please reach out to sales@nanocosmos.de if access to the advanced metric widgets is required.
Filter options
In general you will see metrics for all of the streams available for your organization. It is possible to use the following filter options to get a more fine-grained overview:
- Country: let you select one or more countries
- Tag: can be used to filter for specifc stream names
- you need to assign tags in Bintu to your stream(s) to be able to use them for filtering, this is described in our Blog post about Analytics (search for "Tagging").
- Important: tag selection works like an
ANDfilter, only metrics for streams are shown, which have all of the selected tags assigned
- Time range: to select specific points in time or different time ranges like "last month", "last 24 hours", etc.
- Event (only available for H5Live): let you filter for events you have labeled your streams with
- you need to configure the 'eventId' at the H5Live Player to be able to use that filter (see Player Metrics doc)
The filter option are available directly at the top of each sub-dashboard. When switching to another sub-dashboard, already selected filter options will be applied there as well.
World map
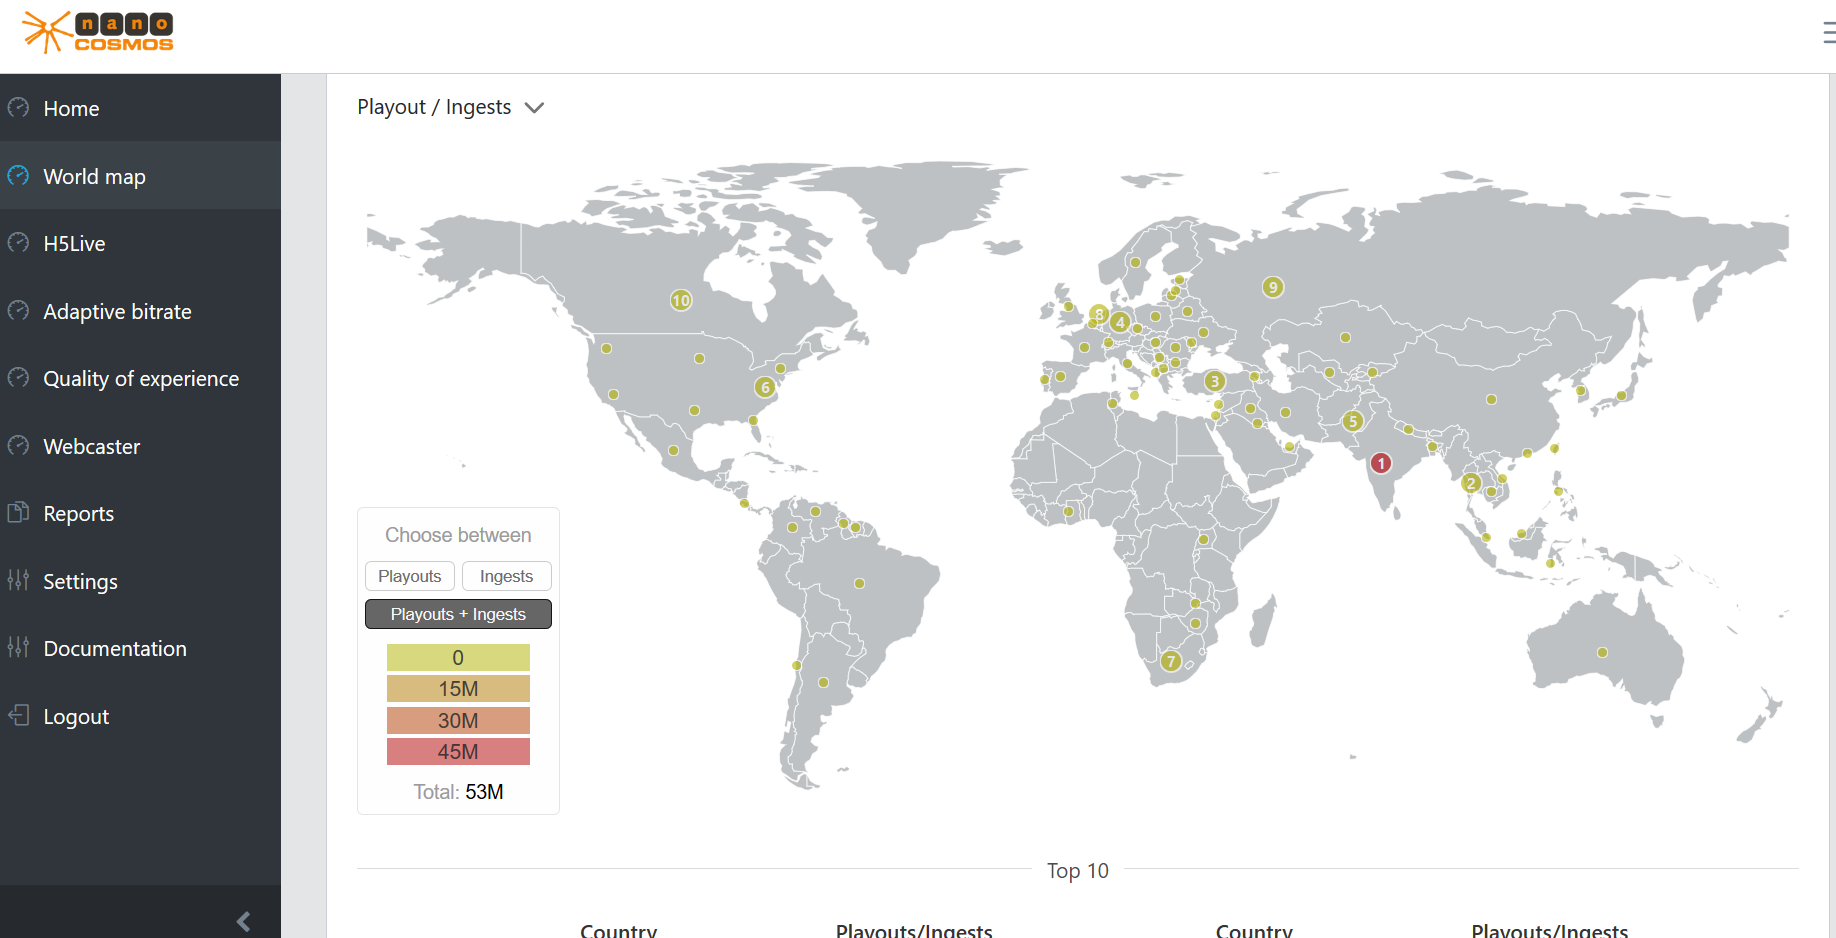
The selected filter options affect all availabe metrics.
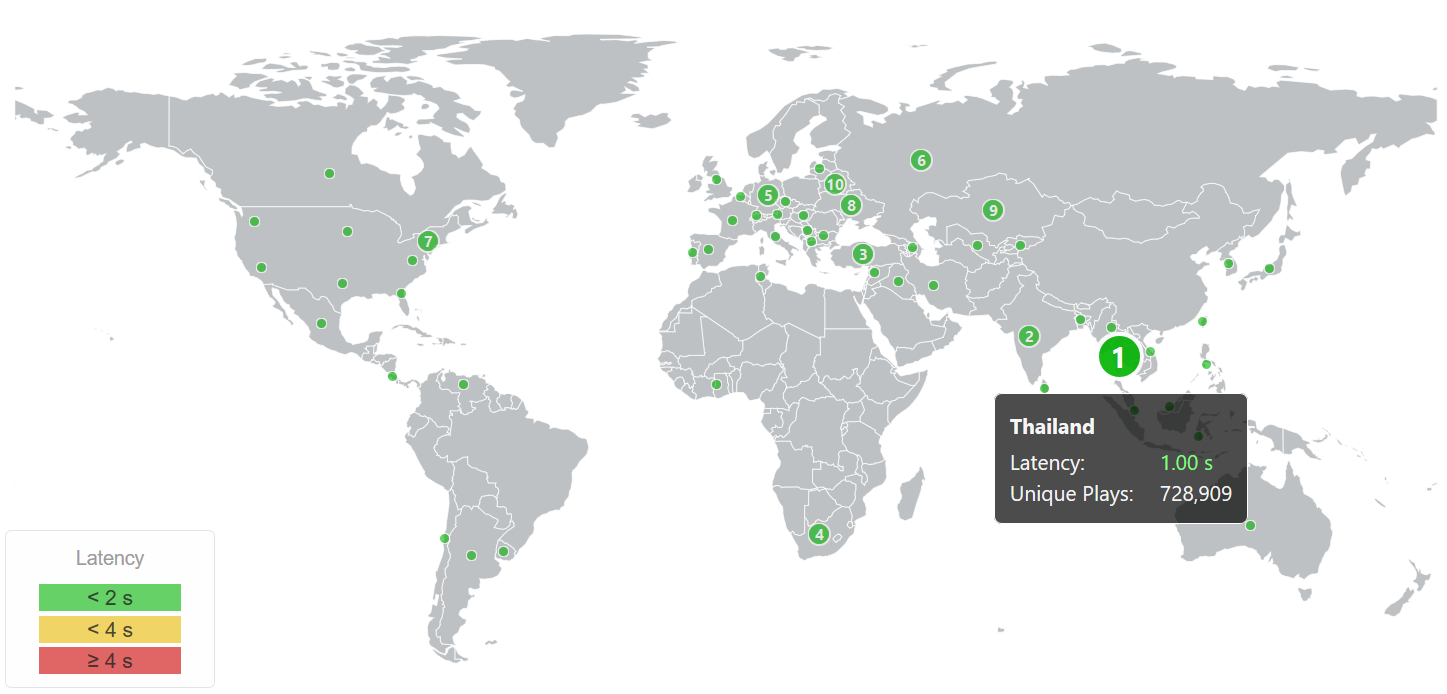
The world map gives an overview where your customers are located and shows statistics per country. You can choose from the following categories:
- Playout/Ingests: how many streams where ingested and played back
- Buffering Play Ratio (only available with H5Live metrics enabled): the ratio between buffer and playback duration over all playouts for a country
- a ratio of 0% means no buffering
- a ratio of 100% means no playback was possible
- for countries like India with a high number of mobile connections and unstable internet connection, a higher buffering/play ratio compared to other countries is expected
- Latency (only available with H5Live metrics enabled): the average playback latency over all playbacks for a country
- Playtime average (only available with H5Live metrics enabled): the average playback duration of a playback event, shows how long a viewer will watch a stream
- Usage (received/sent): the ingest and playback usage (in gigabytes) for a country
A table directly below the world map shows a top ten country list for the selected category. The top ten countries are also highlighted on the world map.
Home
The selected filter options affect all availabe metrics.
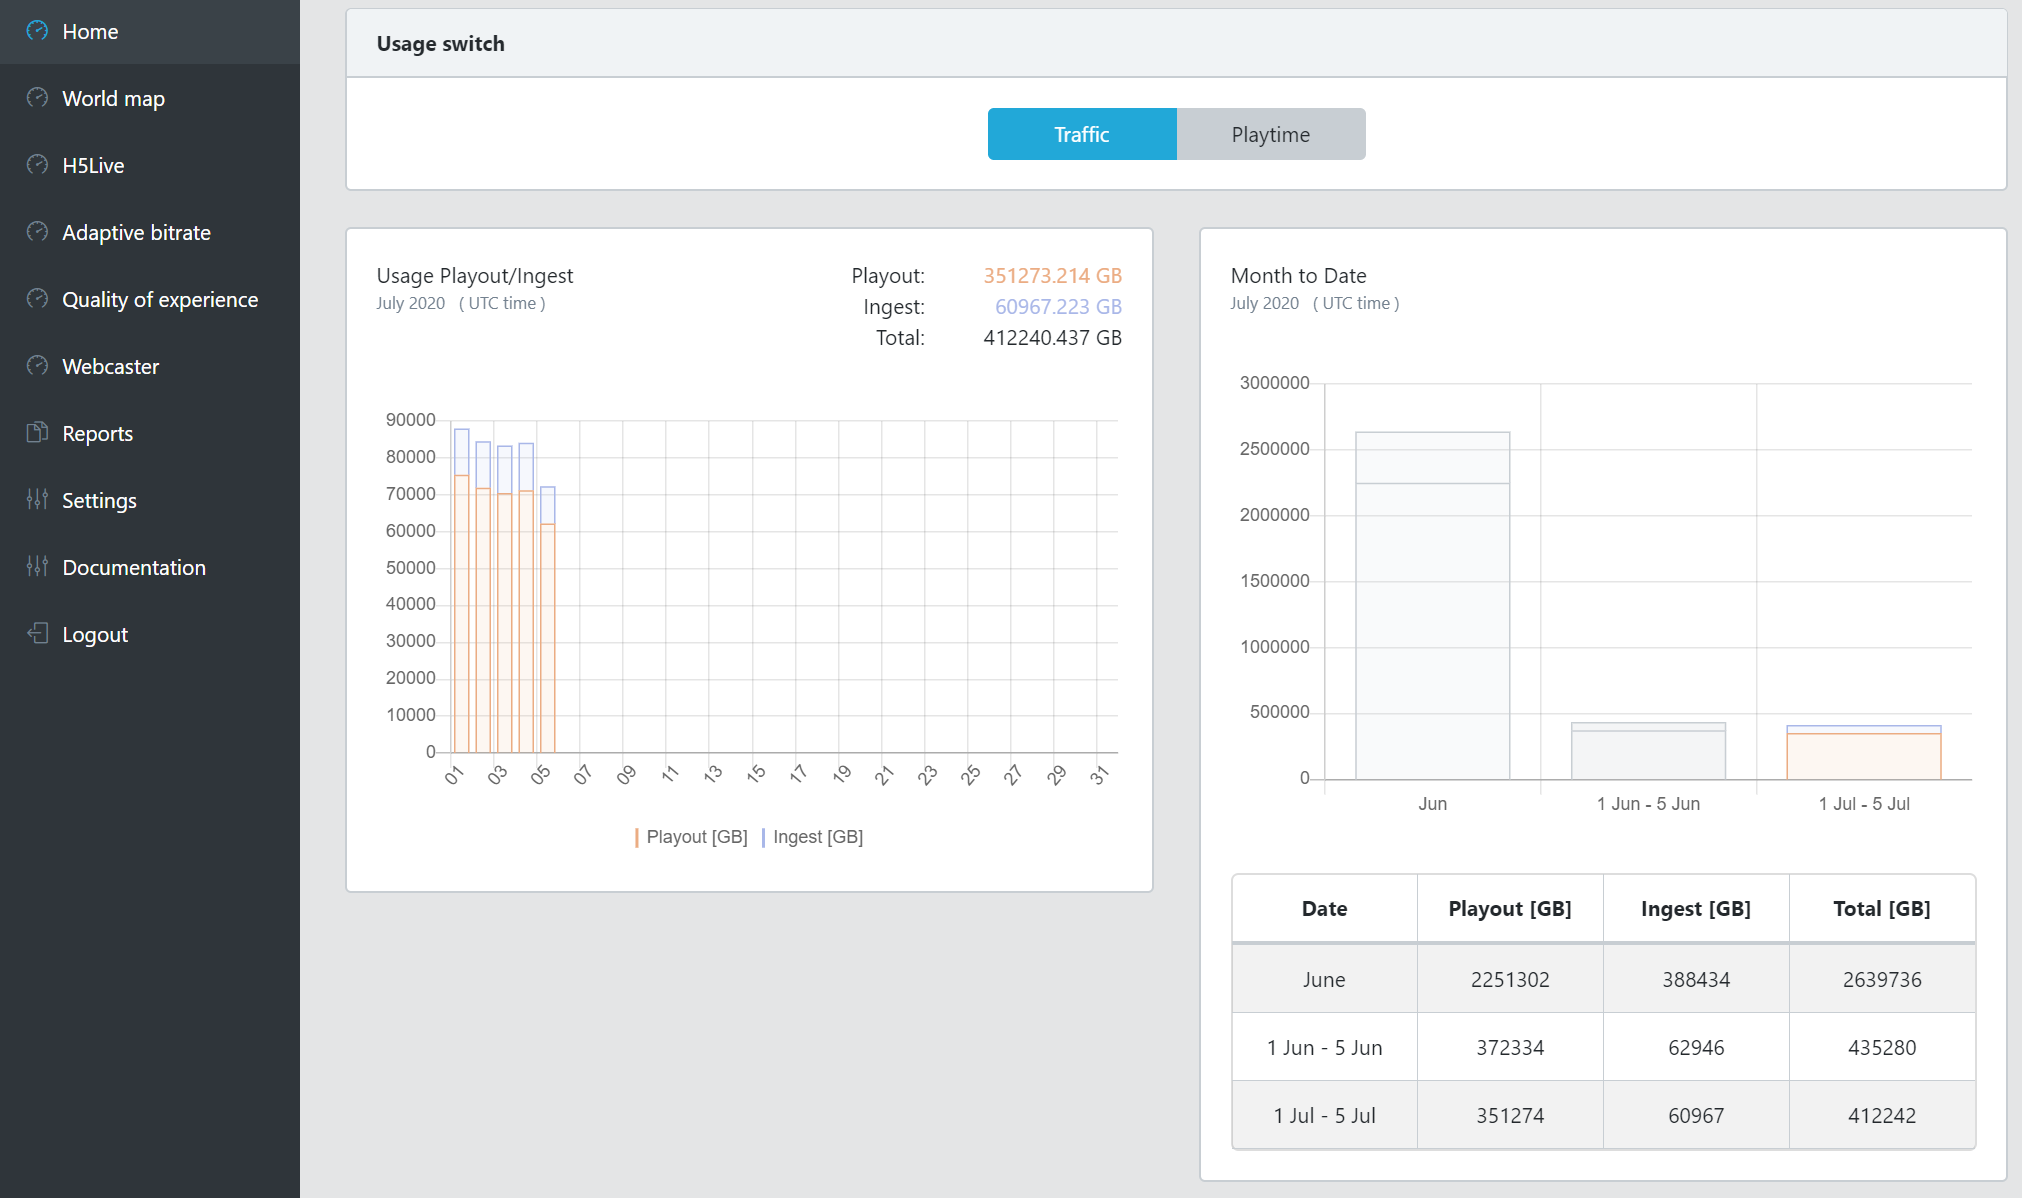
Usage switch
Switch all metrics in Home between data traffic and playtime
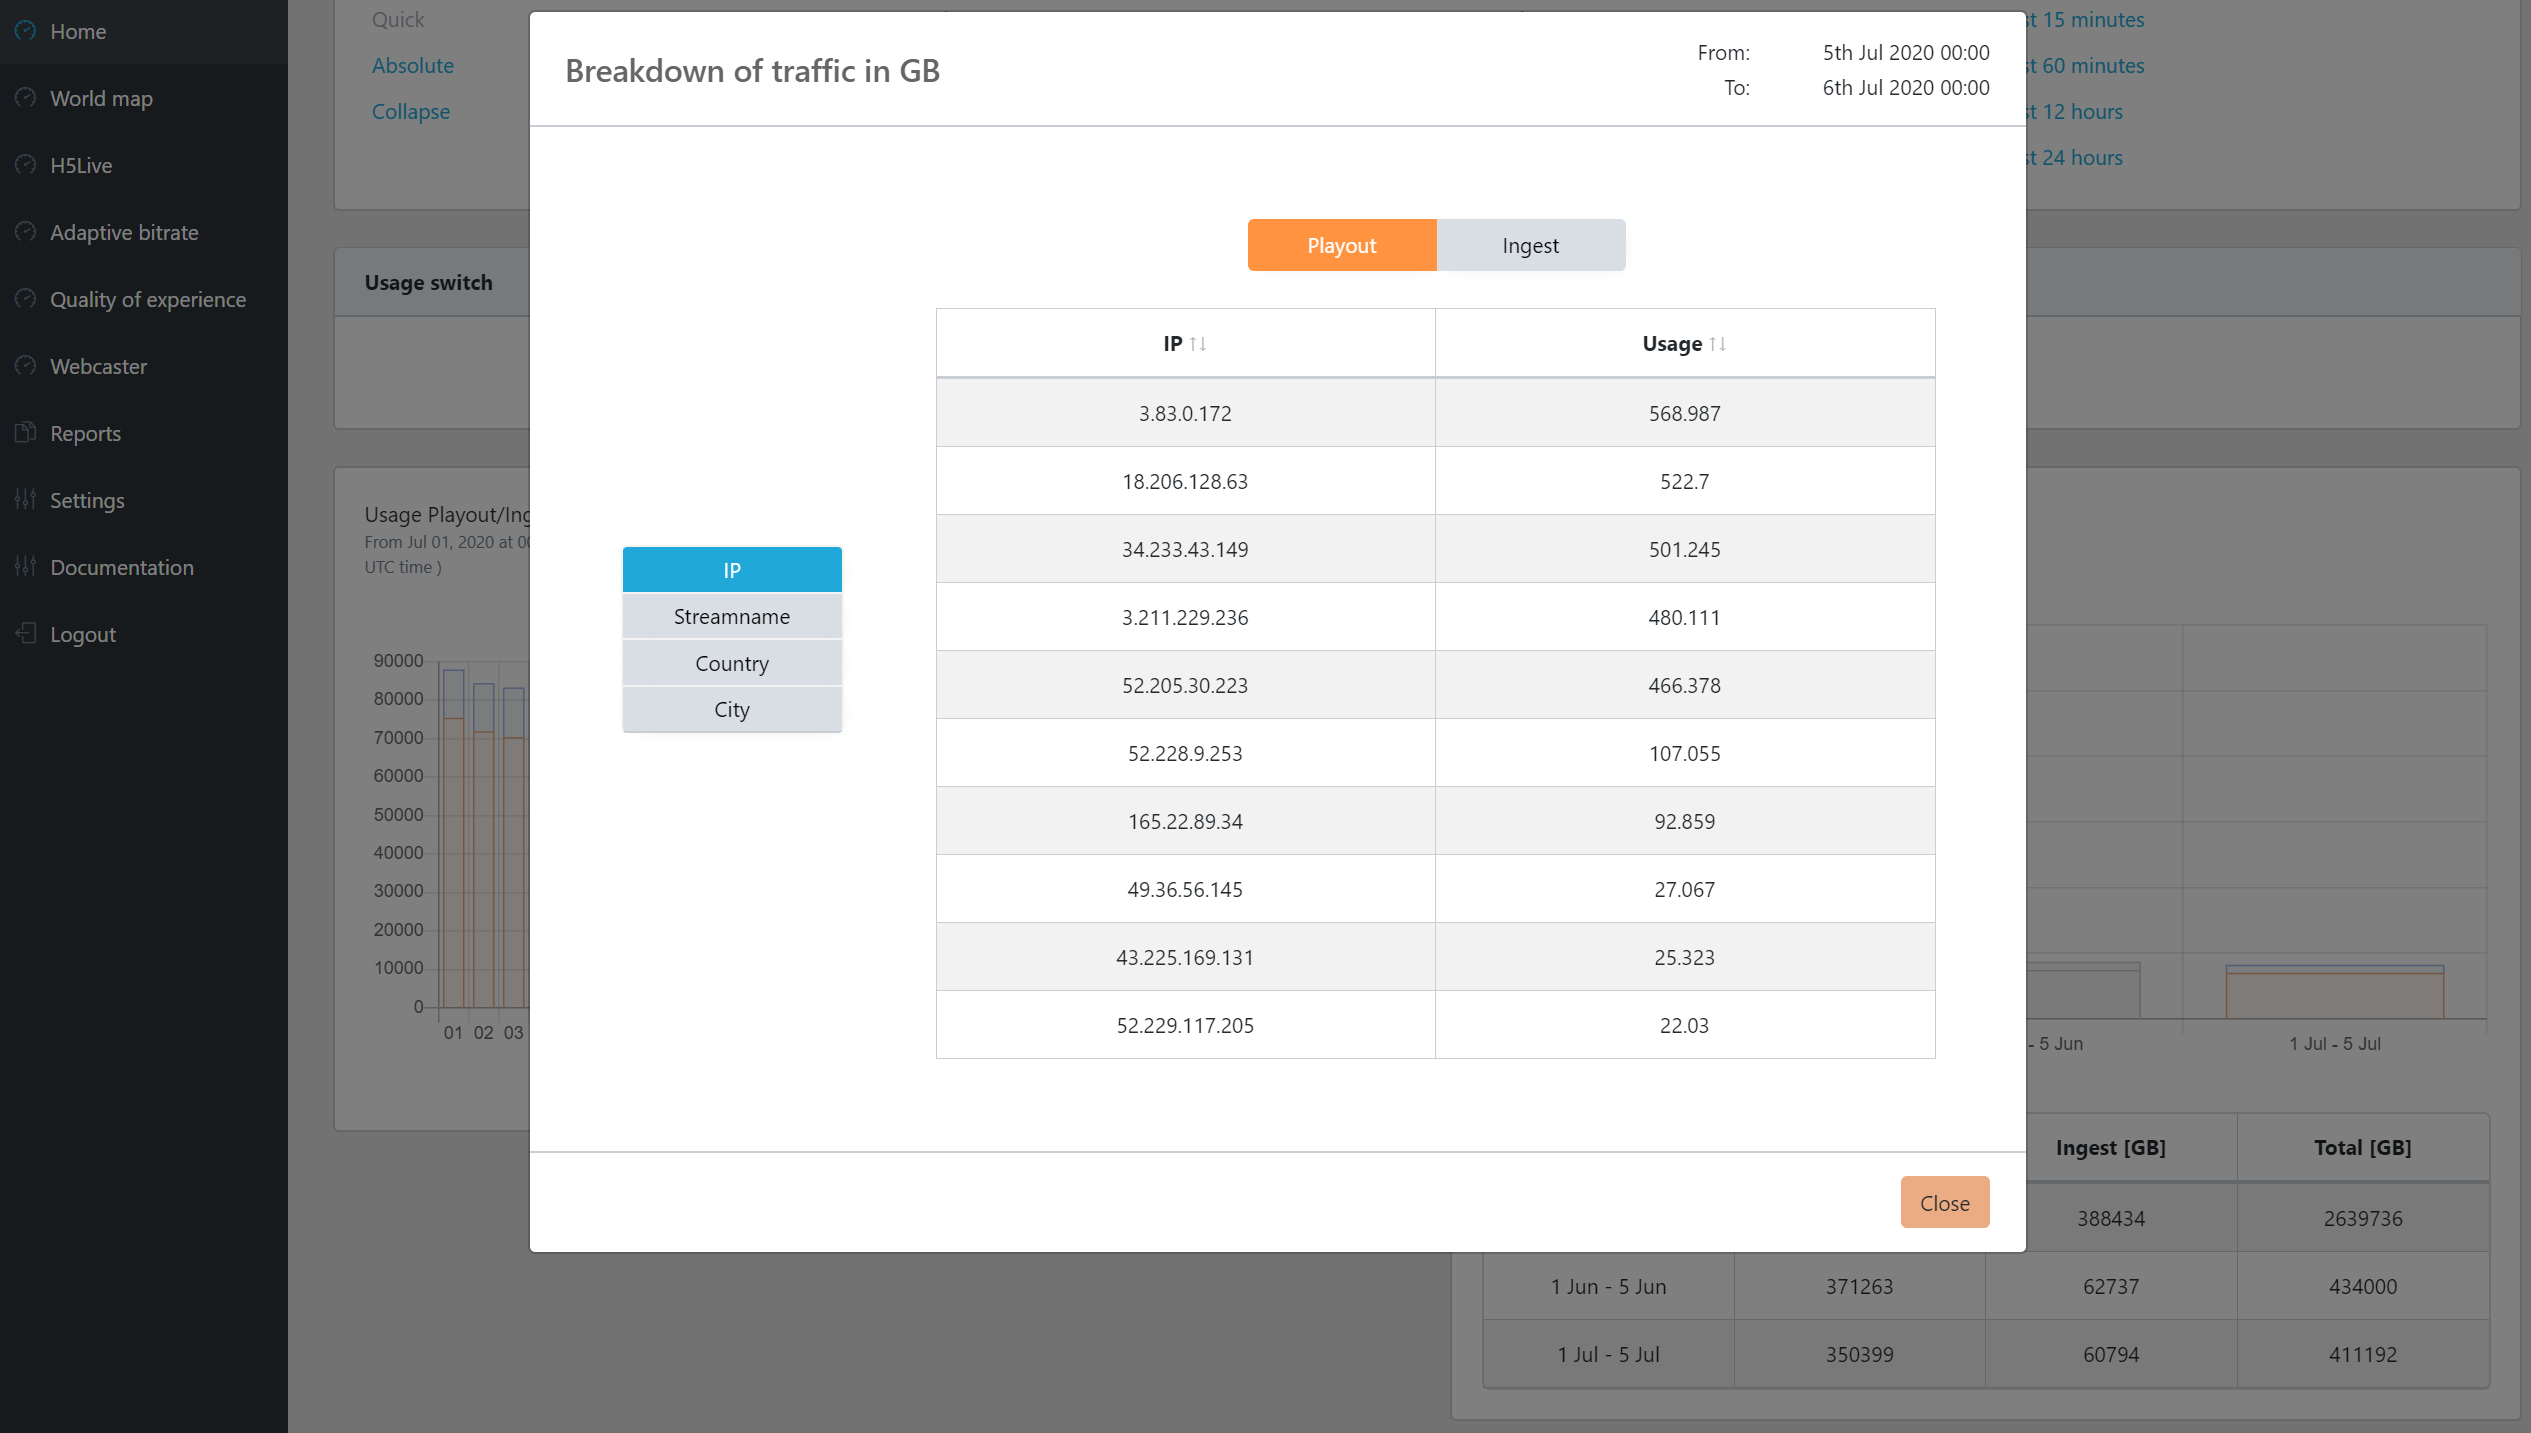
Zoom in for more insight
By clicking on a bar in one of the metrics 'Usage Playout/Ingest', 'Usage Playout' and 'Usage Ingest' an overlay window is being opened. There you can gain more insight about that specific bar by doing your own research. The table shows the TOP 10 (highest) usage for your selected search parameters. You can set two parameters:
- vertical bar (blue): choose a data feature you are interested in (e.g. streamname)
- horizontal bar (orange): choose Playout/Ingest or a specific transfer protocol you are interested in (e.g. H5Live)
Data sent/received
The total traffic per day/hour/minute (depending on the selected time range) for your organization.
Month to Date
The total traffic per month. Can be used to compare the current month with the previous month.
Usage Playout
The total playout traffic for each playout method.
- H5Live: the standard low latency playback method
- RTMP: less scalable
- HLS: long latency playback
- H5Live Token: in case you have your own (RTMP) ingest server, from which the streams are pulled and then distributed in the nanoStream cloud to your viewers
Usage Ingest
The total ingest traffic for each ingest method.
- RTMP: generic ingest method
- Webcaster: plugin-free stream ingest via Browser
GBytes per Streamname
Ingest (received) and playback (sent) traffic for each stream.
GBytes per Client
Playback (sent) traffic for each client (referrer).
GBytes per IP
Ingest (received) and playback (sent) traffic for each IP.
Countries
A pie-chart which shows the percentage distribution of total traffic for countries.
H5Live
Most of the metrics are only available with H5Live metrics enabled. The selected filter options affect all availabe metrics.
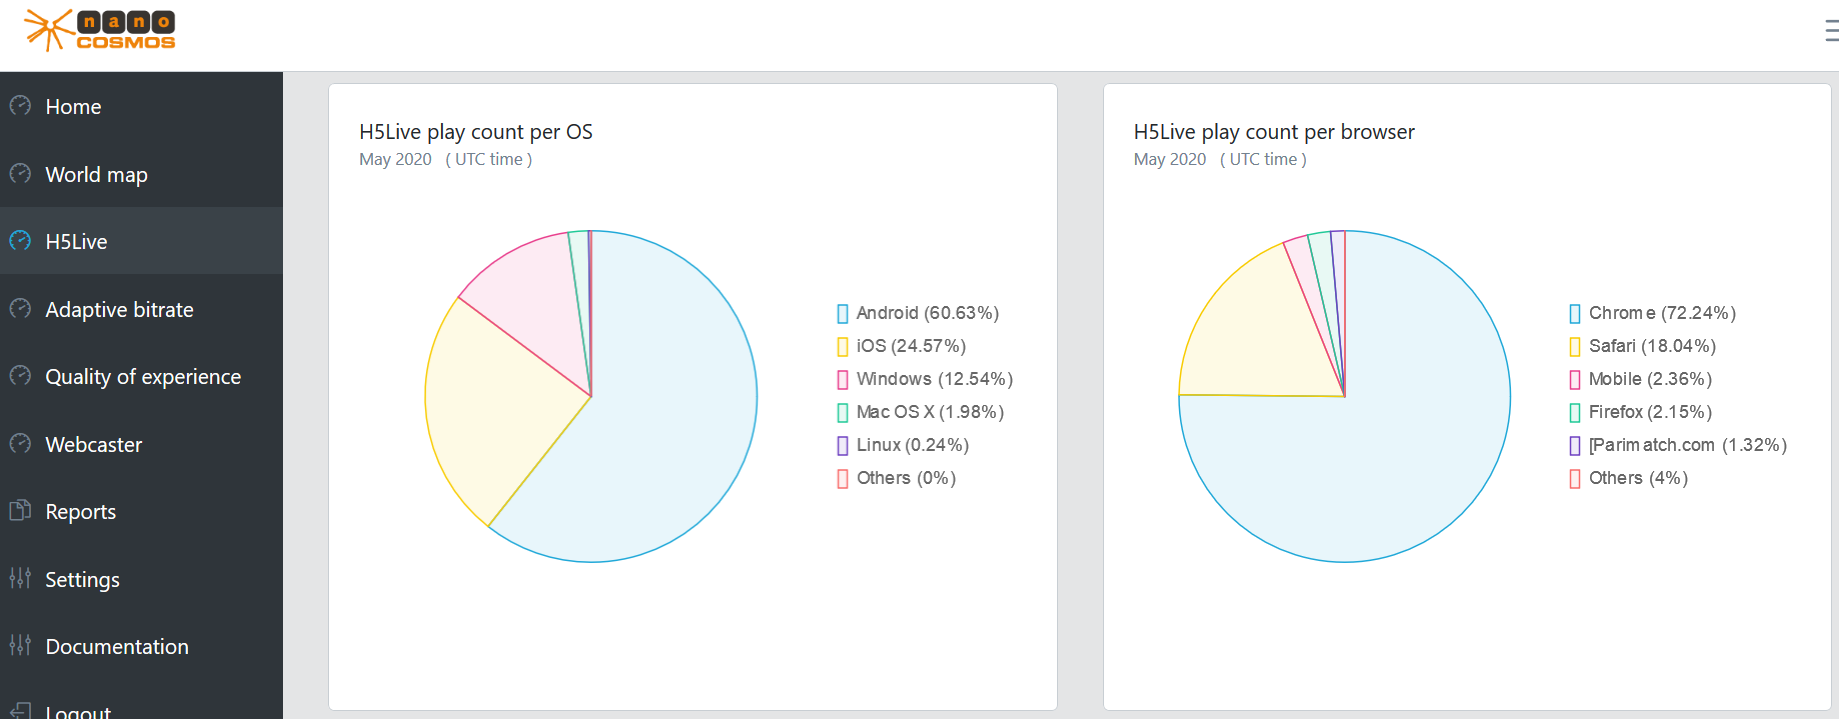
H5Live play count per OS
Percentage distribution of playbacks on operating systems (OS).
H5Live play count per browser
Percentage distribution of playbacks in Browsers.
Maximum concurrent H5Live viewers
The concurrent viewer count over all streams (dependent on the filter options) for a point in time.
Reasons for stopping
The number and types of reason why playbacks were stopped or interrupted. The link in the top right will open a new page with a explanation for each stop reason.
Play Buffering Ratio
The ratio between buffer and playback duration over all playouts. Similar to the same category of the world map.
Player Loading Count
The number of player initalisations (clients which attempt to playback a stream) per country.
Average and median of player buffer length in seconds
The buffer length is the decisive factor for the latency. Similar to the "Latency" category of the world map.
Median play start time in seconds
The time it takes until the playback of a stream is started - first frame rendered by the H5Live player.
Status/Error Codes
The number and types of status and error codes which occurred during playbacks. The link in the top right will open a new page with a explanation for each code.
Average and median of played time in seconds
The average and median playback duration of a playback event, shows how long a viewer will watch a stream Similar to the "Playtime average" category of the world map.
Used player versions
Percentage distribution of playbacks based on the used version of the H5Live player.
Webcaster
Most of the metrics are only available with Webcaster metrics enabled. The selected filter options affect all availabe metrics.
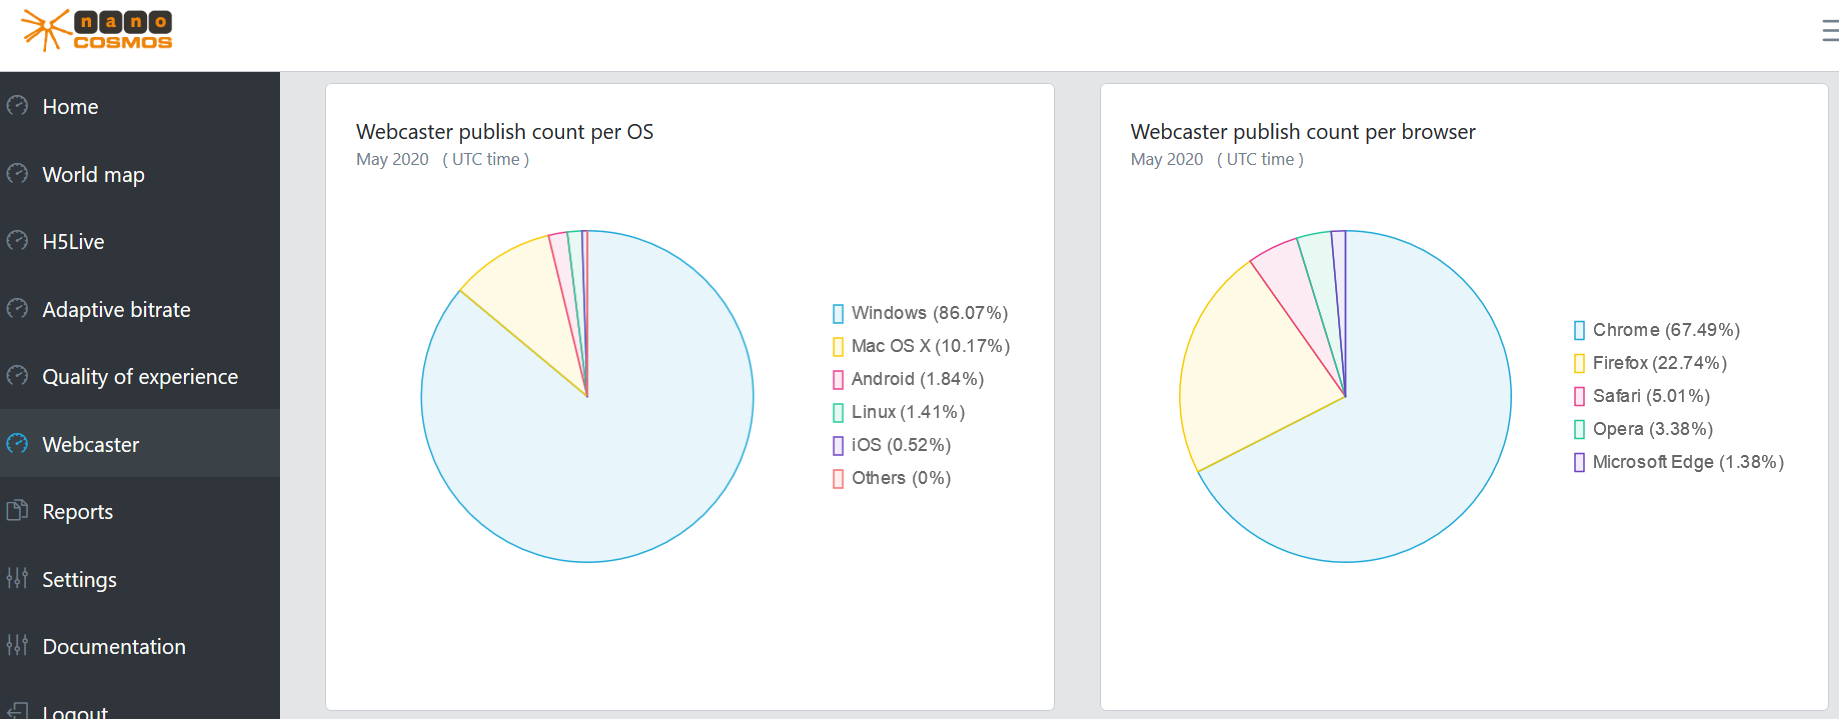
Webcaster publish count per OS
Percentage distribution of ingests on operating systems (OS).
Webcaster publish count per browser
Percentage distribution of ingests in Browsers.
Average and median of video bitrate
The average and median bitrate used by the video encoder over all ingested streams. Note that the video encoder might reduce the bitrate if the available bandwidth is not high enough for the user specified bitrate.
Average and median of audio bitrate
The average and median bitrate used by the audio encoder over all ingested streams.
Average and median of ingest time in seconds
The average and median duration a stream was live, over all ingested streams.
Used webcaster versions
Percentage distribution of ingests based on the used version of the Webcaster.
Reports
Makes it possible to export metrics. Generates a PDF with usage values (data sent and received) for the selected time range. The PDF contains the total numbers and two histograms.